

The Champions League Dashboard arose from the idea of showing all the benefits of Business Intelligence (BI) applied to an enjoyable and well known business as Football is. And, besides, using mostly Open Source Business Intelligence, like Pentaho , Kettle , Mondrian , STPivot ...
We´ve created too: Tablero Futbolero (Spanish League)
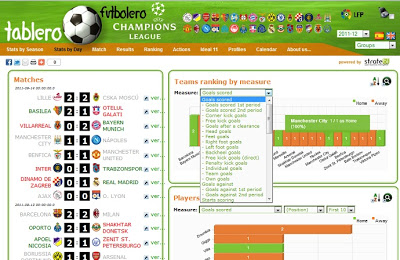
This website lets you analyze UEFA Champions League statistics in a user friendly and intuitive way; demonstrating how to convert from numbers to information. Starting from a beginner to become an expert on football stats.
Explore your
favourite’s
team statistics and compare them to the other in search of characteristics and tendencies that could be affecting its results. Hope you enjoy it!!
Main Features:
Stats by season
Have a look at players and teams along the full season (or until the selected day).
- League table and rankings
- Complete season stats and metrics
- Team rank depending on selected metric
- Player rank depending on selected metric
Stats by day
Summary of the matches played in the current day beside the performance of teams and players:
- Day final results of all matches
- Day Stats.
- Team rank depending on selected metric
- Player rank depending on selected metric
- Access to each individual match stats as well as team and footballers ones.
Match
All outstanding information referring to a selected match. Content:
- Match statistics
- Team lineups on the football ground
- Match events (Goals, Cards, Substitutions, …)
- Metrics by team
- Player rank by metric
Season results
- Show only your favourite’s team results
- Individual match stats
- Team stats
- Match results matrix
Custom ranking
- Team, player, regions, day, match and referee ranks
- Ad-hoc report which contains a wide variety of filters.
Analysis of passing sequences, assists, shots and goals
- Analyze different sides of an offensive play
- Histogram with percent of occurrence
- Customized rank with multiple parameters
Don´t hesitate to contact us if you have any idea to improve Champions League Dashboard.